Wing Tips: Debug Python Services Running on AWS with Wing Pro
In this Wing Tip we're continuing our look at how to use Wing Pro to remotely develop Python code running on an AWS instance. This time we'll set up remote debugging of code that is launched from outside of the IDE. This can be useful in debugging web apps and other services.
Prerequisites
Before getting started, you will need an AWS instance that you can SSH into, and you'll want to set up a Wing project for that AWS instance. If you don't already have this working, take a look at last's weeks Wing Tip: Remote Python Development on AWS with Wing Pro.
The small debugging example given in the above link launched the remote code being debugged from the IDE. The code actually runs on the AWS instance, but Wing launches it with the help of its remote agent. Now we're instead going to set up debugging remote code that is launched outside of control of the IDE.
This is done by (1) using Wing Pro's remote development support to set up a reverse SSH tunnel to the remote AWS instance, so that the debugger can connect back to the IDE, and then (2) inserting an import into code that starts debug and makes the connection to the IDE.
Setting up Remote Listening
In the project you have set up for your remote AWS instance, click on the bug icon in the lower left of Wing's window to check on Accept Debug Connections:

Now if you hover the mouse over the bug icon, you will see that Wing reports that it is listening for debug connections on the remote host on port 50050, as well as listening on the local host:

Starting Debug
To keep things simple, rather than setting up a web development framework or other service, we'll test with a simple helloworld.py example that we launch manually from the command line outside of Wing.
You can create this file on the AWS instance by right-clicking on a directory you previously added to Wing's Project tool and selecting Create New File. This collects the new file name in a dialog or, in some keyboard configurations, in the status area at the bottom of Wing's window, and then opens the file in the editor.
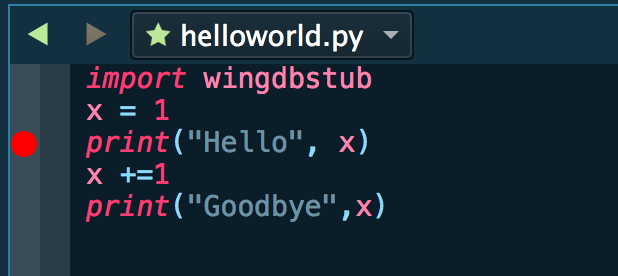
Then paste in the following code and save the file:
import wingdbstub
x = 1
print("Hello", x)
x +=1
print("Goodbye",x)
Notice that the first line import wingdbstub starts debug and connects to the IDE through the reverse SSH tunnel you set up in the previous section.
In order for this to work, you need to copy the automatically preconfigured file ~/.wingpro7/remote-#.#.#.#/wingdbstub.py on the remote host (where #.#.#.# is the version of Wing you running) into the same directory as helloworld.py. This can be done by opening the file in Wing and using Save As. Or just connect to your AWS instance, cd into your target directory, and copy it into place:
cp ~/.wingpro7/remote-#.#.#.#/wingdbstub.py .
If you are using Lightsail, a convenient way to connect to your instance is Connect Using SSH under the Connect tab in the Amazon Lightsail management interface.
Finally, set a breakpoint on line 3 of the test code so it will not just run to completion, but instead will stop in Wing's debugger. This is done by clicking on the leftmost margin in the editor:

Now you can start debug just by launching the test code outside of Wing:
python3 helloworld.py
The first time you do this, Wing may refuse the connection and ask whether you want to accept the security token for this host. This happens if you installed the remote agent earlier from a different Wing installation:

If this dialog appears, click Accept and then start the test code a second time:
python3 helloworld.py
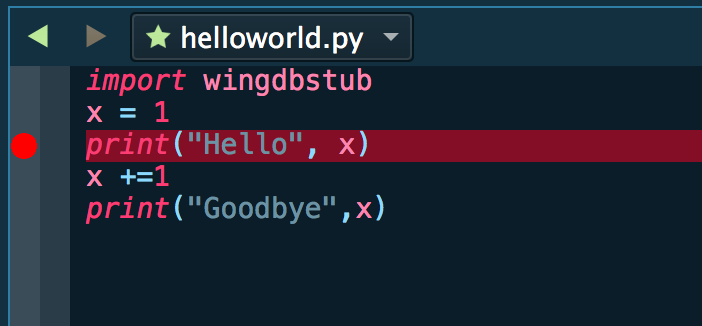
This time Wing will accept the connection and should stop on your breakpoint:

From here, you can inspect your debug process in the Debug Console or Stack Data, set other breakpoints or conditional breakpoints, step through code, and so forth. For more information on the capabilities of Wing's debugger, see the Debugger Quick Start or the tutorial in Wing's Help menu.
Notes
To actually set up Wing to work with a web development framework on your AWS instance, see our How-Tos for Flask, Django, or other web development frameworks. These explain additional configuration that may be needed in each case.
Wing's debugger also provides a simple debugger API that may be useful, for example in developing a way to turn the debugger on and off on demand or controlling which threads are debugged.
For detailed documentation see the Debugger and Advanced Debugging Topics chapters in Wing Pro's user manual.
That's it for now! We'll be back soon with more Wing Tips for Wing Python IDE.
As always, please don't hesitate to email support@wingware.com if you run into problems or have any questions.
Share this article:


