Wing Tips: Goto-Definition From the Interactive Shells in Wing
In this Wing Tip we'll take a quick look at a lesser-known but often useful feature in Wing: Jumping from symbols in the integrated Python shells to their point of definition in source code. This makes it a snap to bridge from runtime symbols to the source code where they are actually defined and used.
Debug Console Example
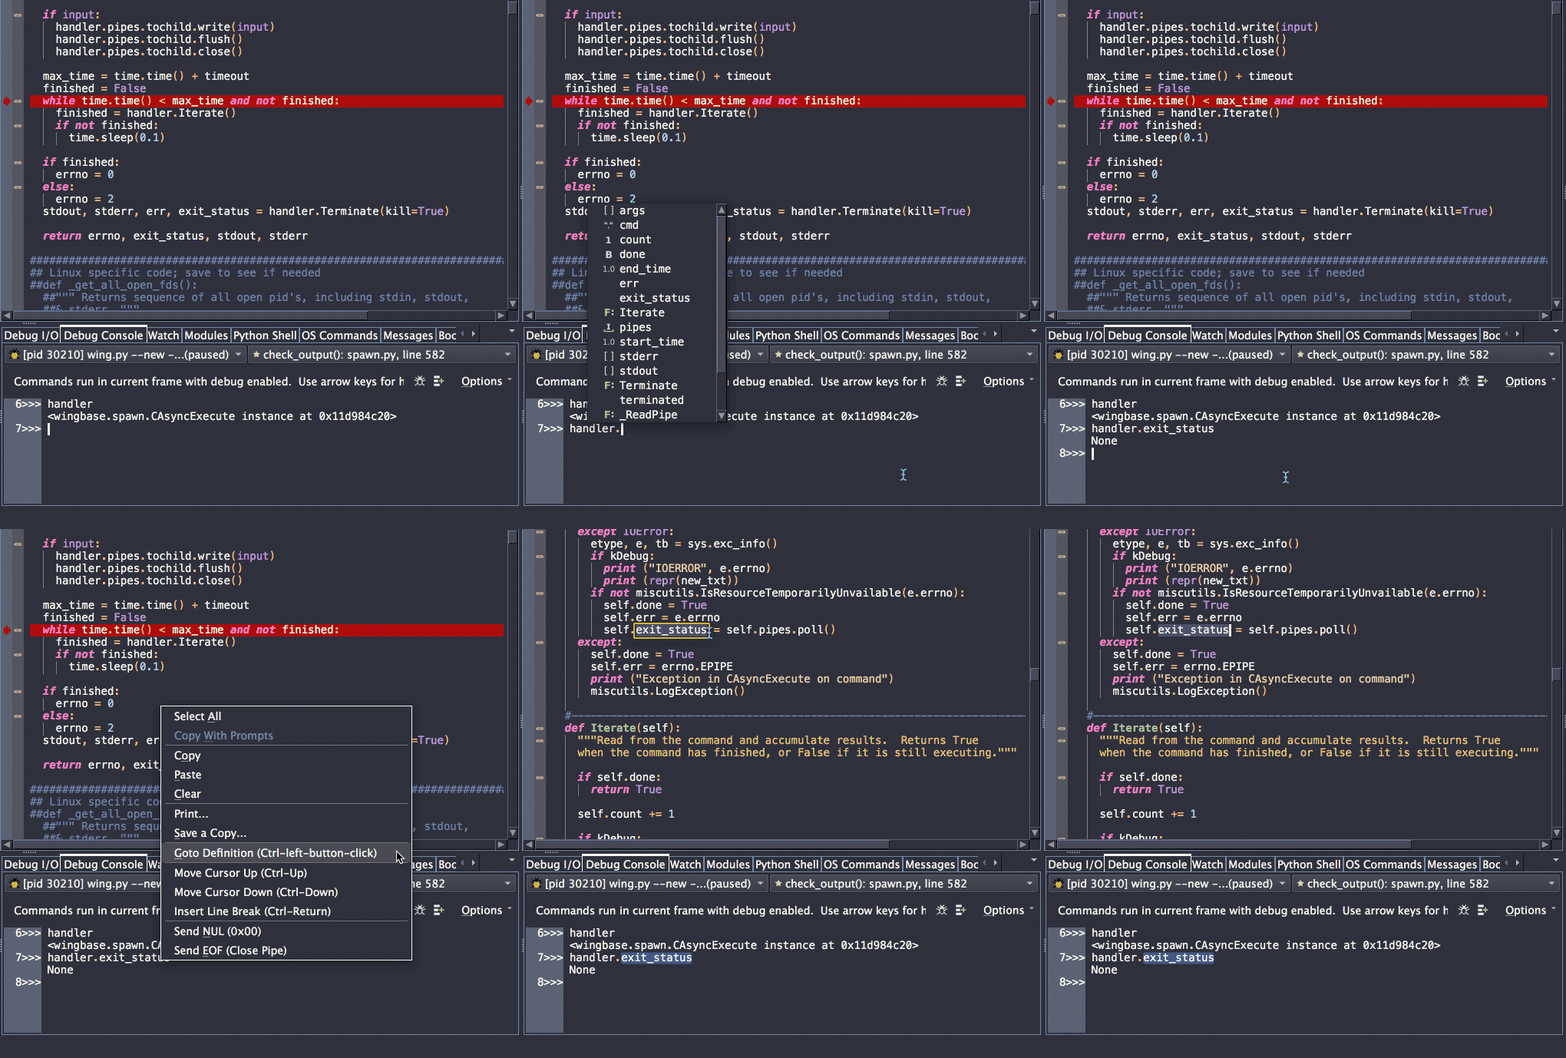
In this example, the debugger is stopped and I'm working in Wing Pro's Debug Console, which is an interactive shell that runs in the context of the currently selected debug stack frame. While trying to determine why handler.exit_status is None, I jump to its point of definition from the right-click context menu:

From here, I could set a breakpoint and restart debug, or right-click on the editor to select Find Points of Use to see all the points of use of exit_status.
Python Shell Example
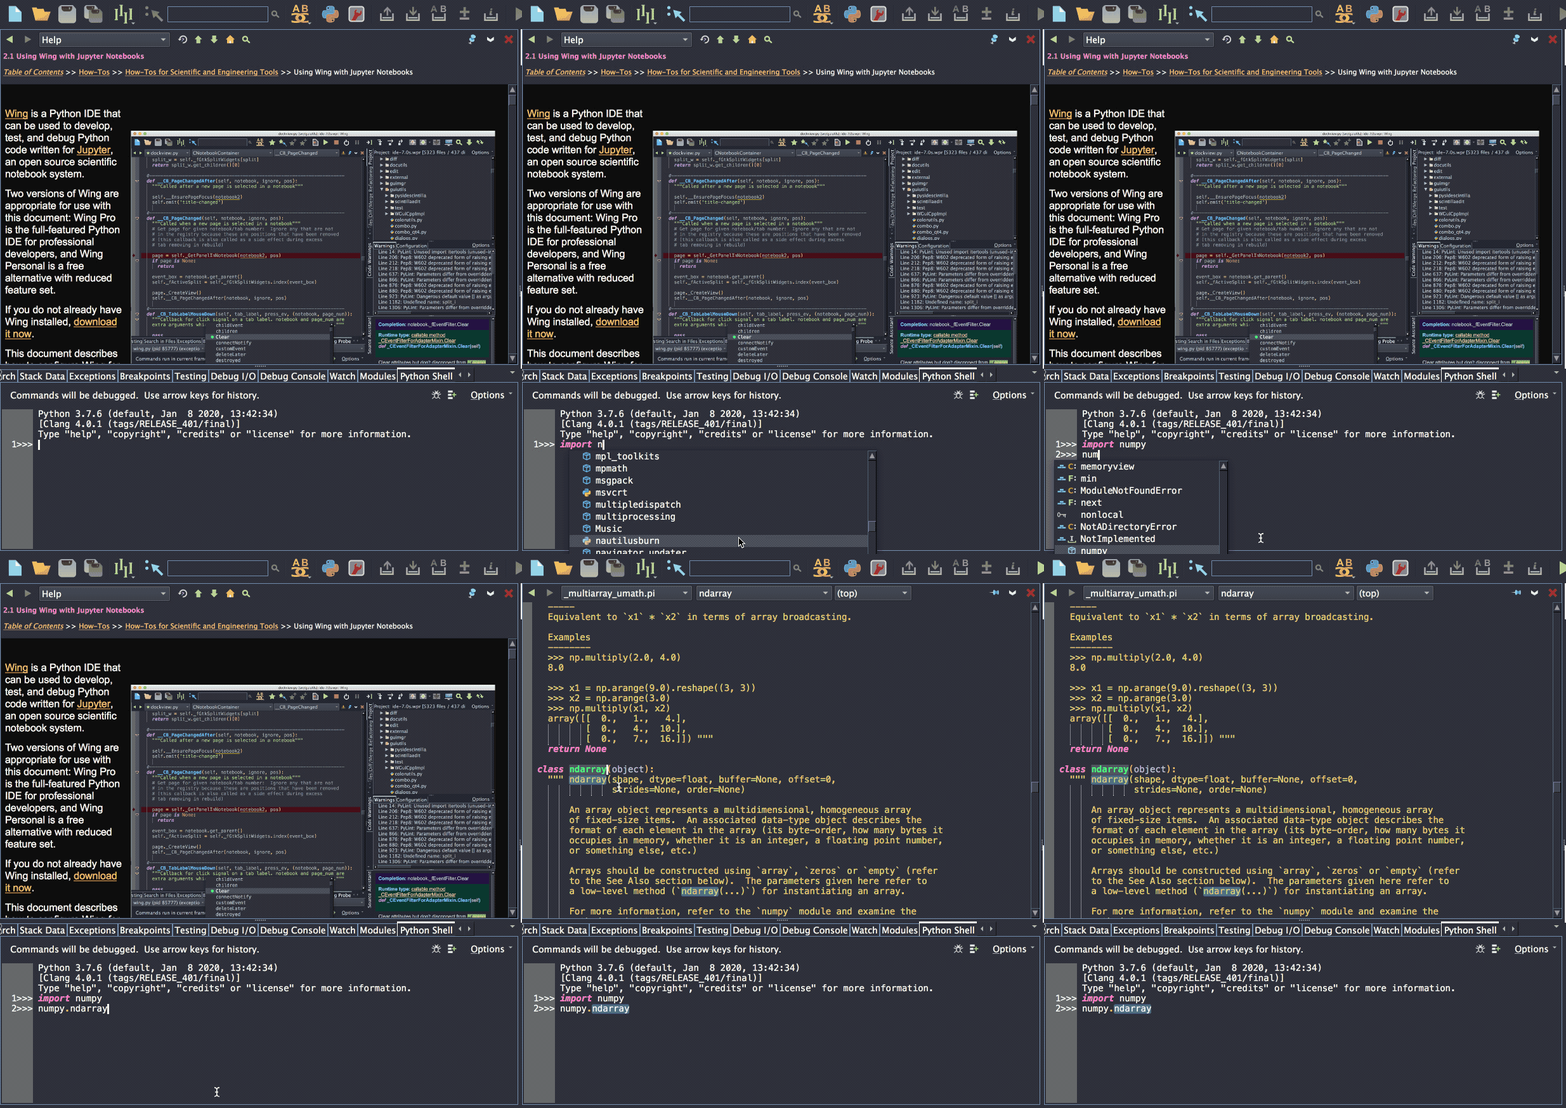
Similarly, I can import a module in the Python Shell in Wing Pro or Wing Personal and jump to the point of definition of symbols in the module. Here I'm using this technique to bring up the source code for numpy's ndarray:

In this case, I'm pressing F4 to go to the definition, rather than using the right-click context menu.
Traversing Visit History
To get back from the point of definition to the previously displayed code in the editor, use the browser-like forward/back arrow buttons in the top left of the editor:

Pressing Alt-Left or using any other key binding for the command visit-history-previous also goes back in the editor's visit history.
That's it for now! We'll be back soon with more Wing Tips for Wing Python IDE.
As always, please don't hesitate to email support@wingware.com if you run into problems or have any questions.
Share this article:


